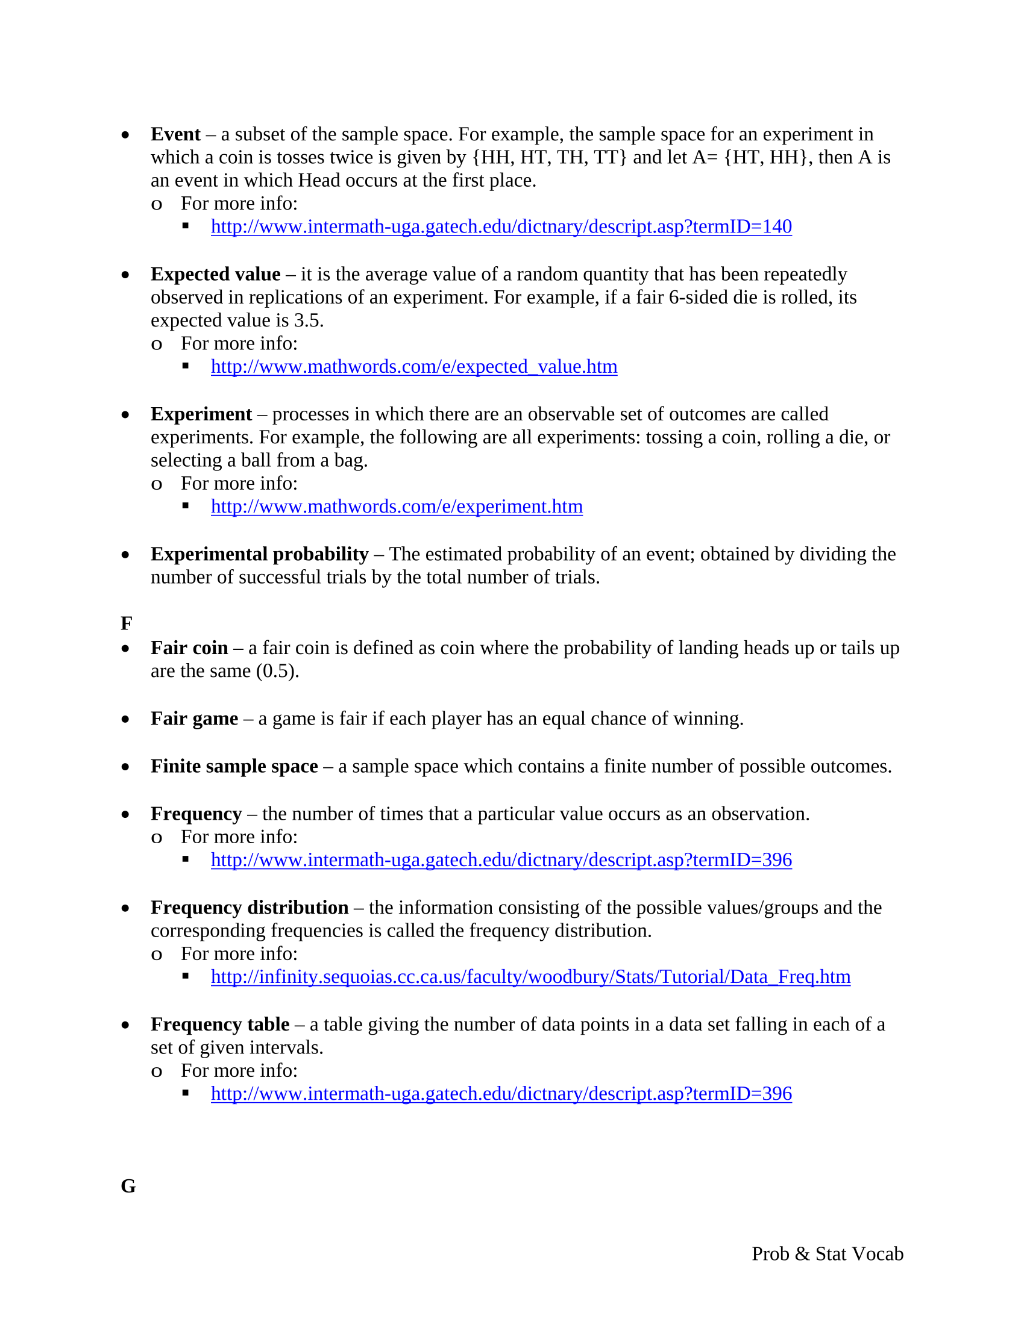
Preview 1
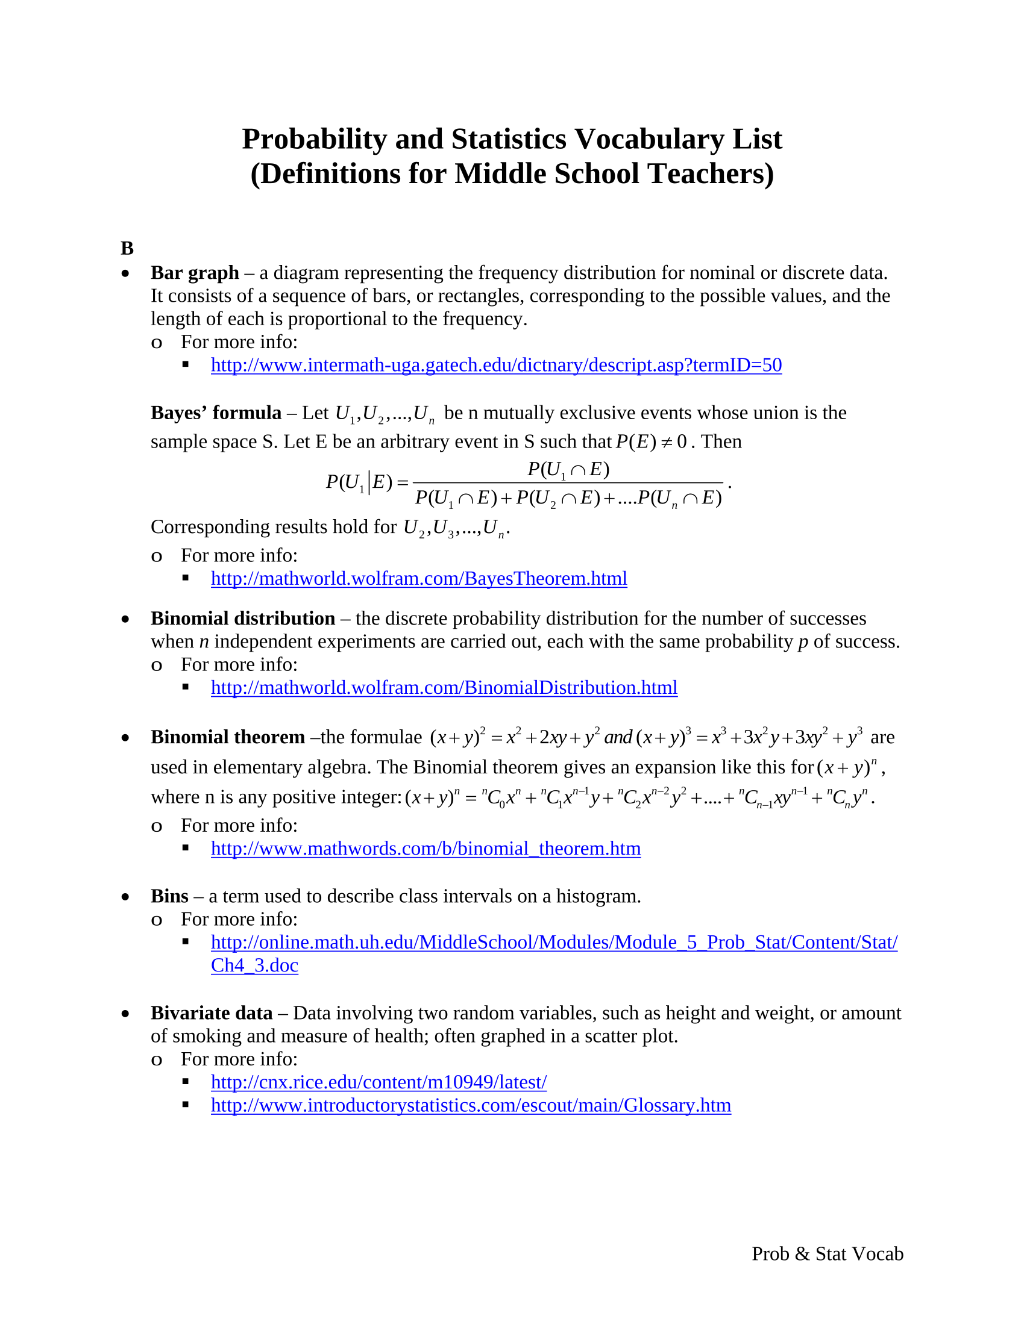
Probability and Statistics Vocabulary List (Definitions for Middle School Teachers) B • Bar graph – a diagram representing the frequency distribution for nominal or discrete data. It consists of a sequence of bars, or rectangles, corresponding to the possible values, and the length of each is proportional to the frequency. o For more info:
Preview 1

Preview 2
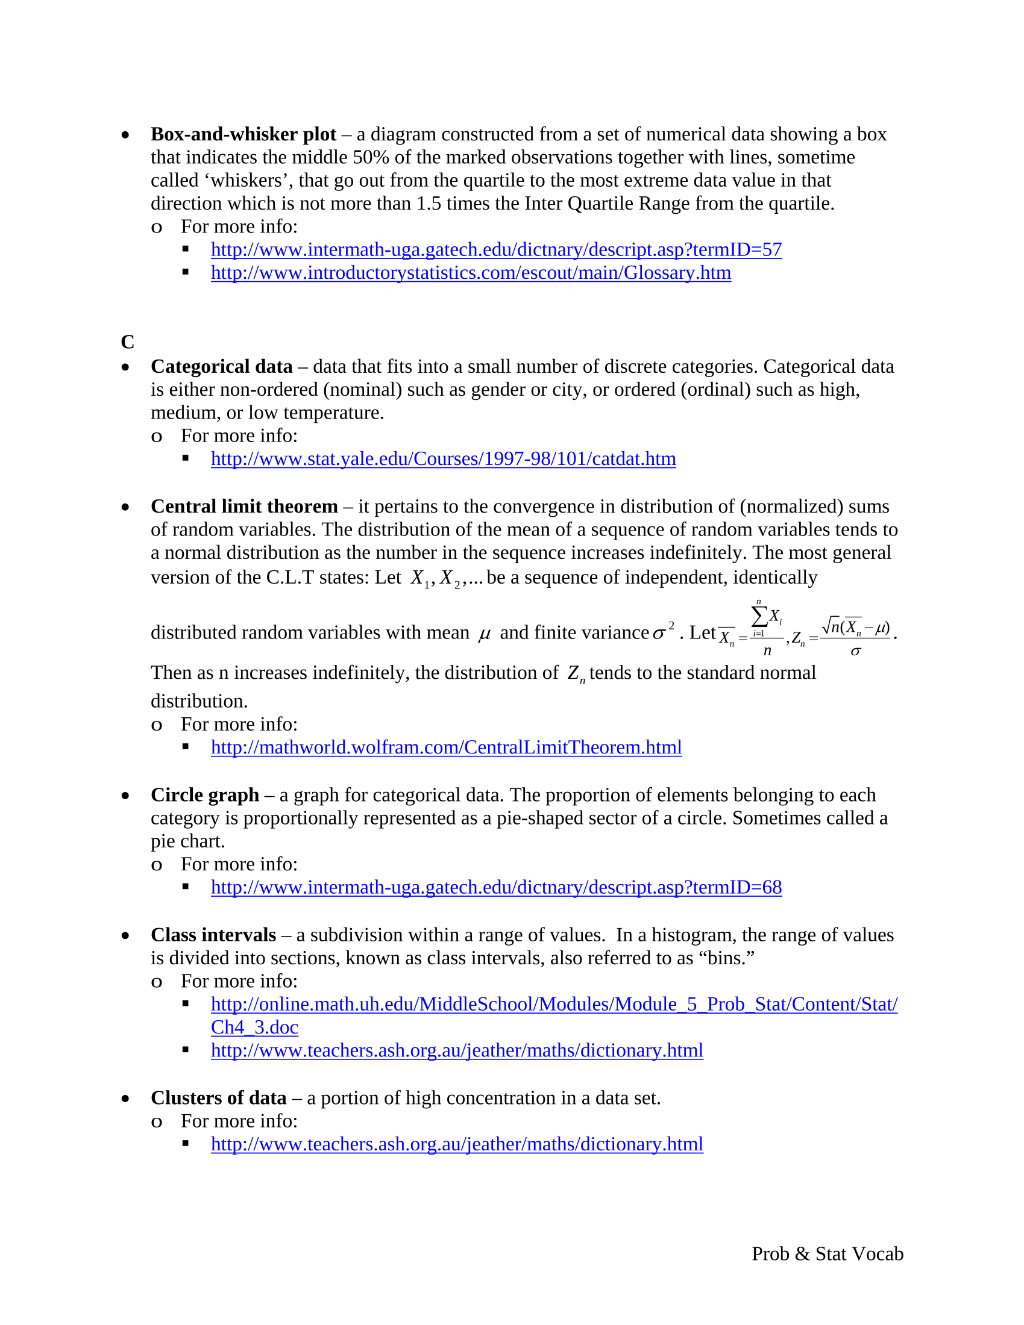
Preview 3
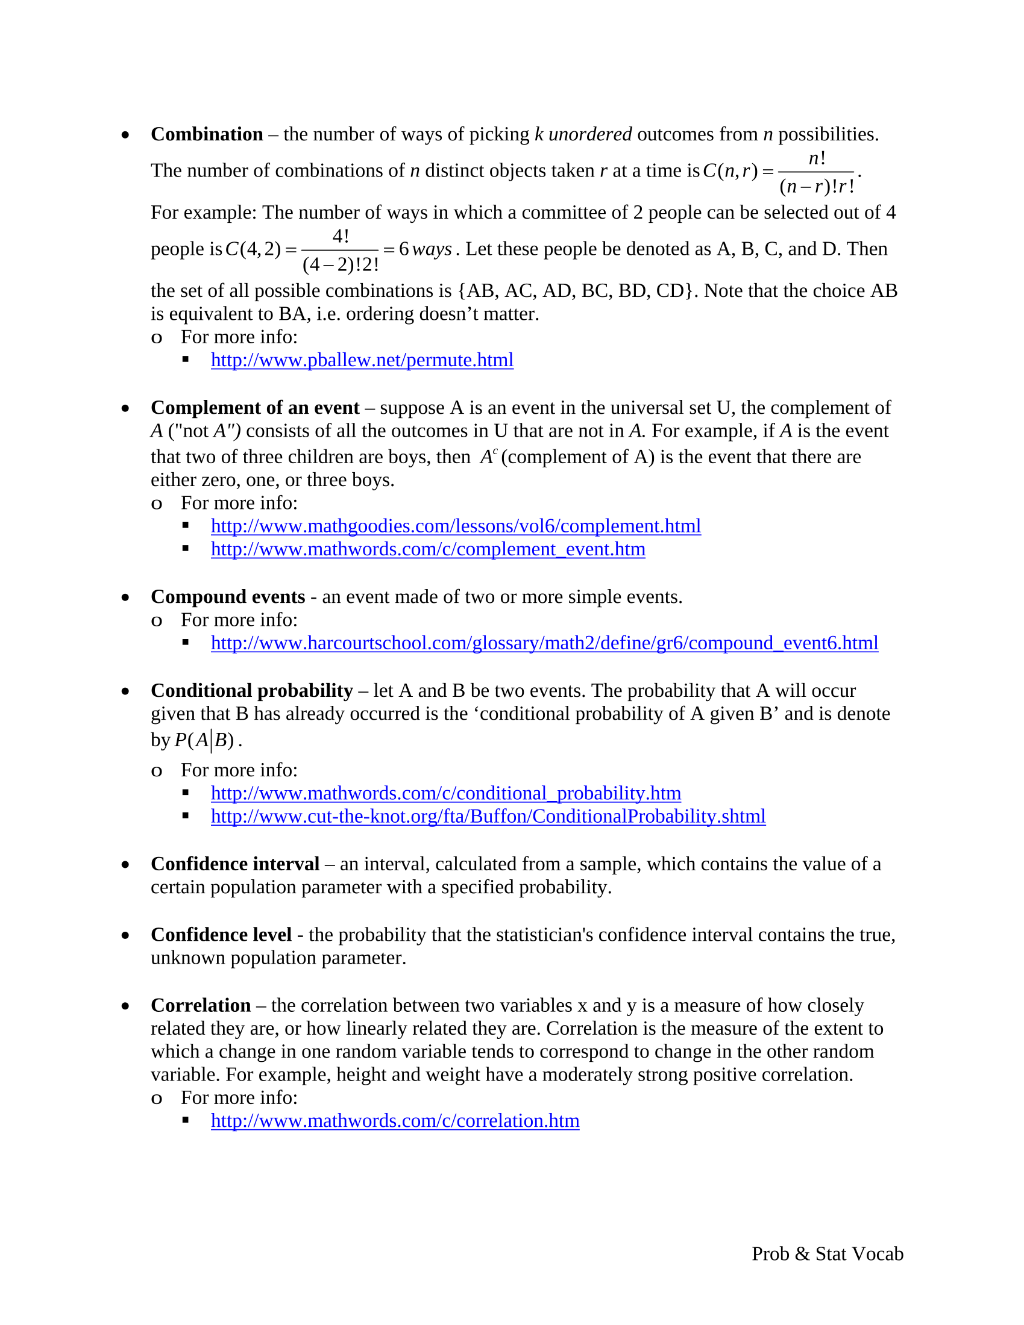
Preview 4
Preview 5
Preview 6
