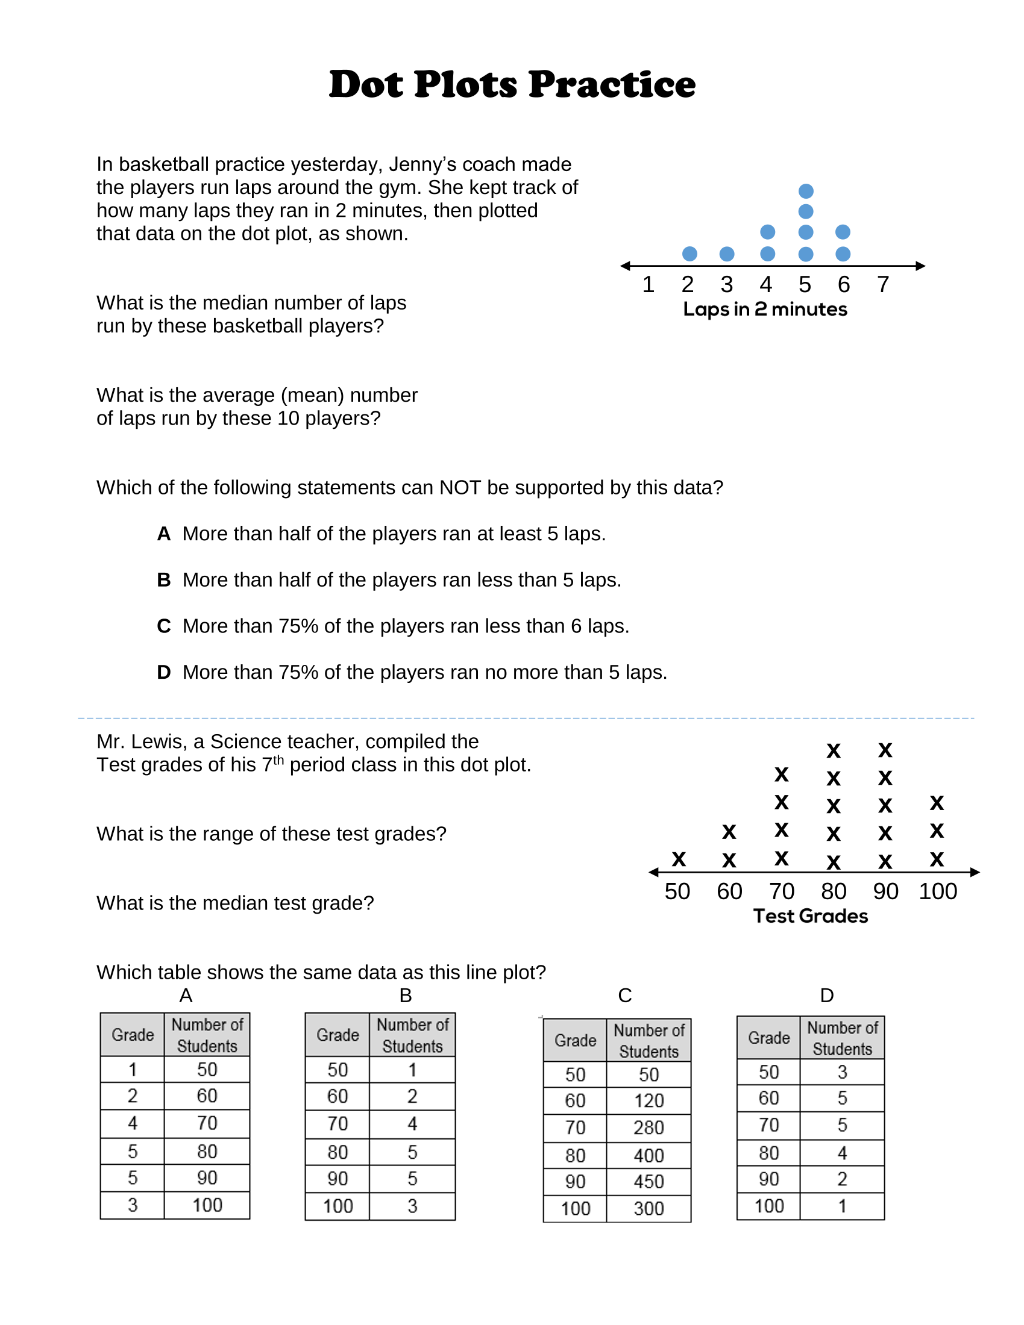
Preview 1

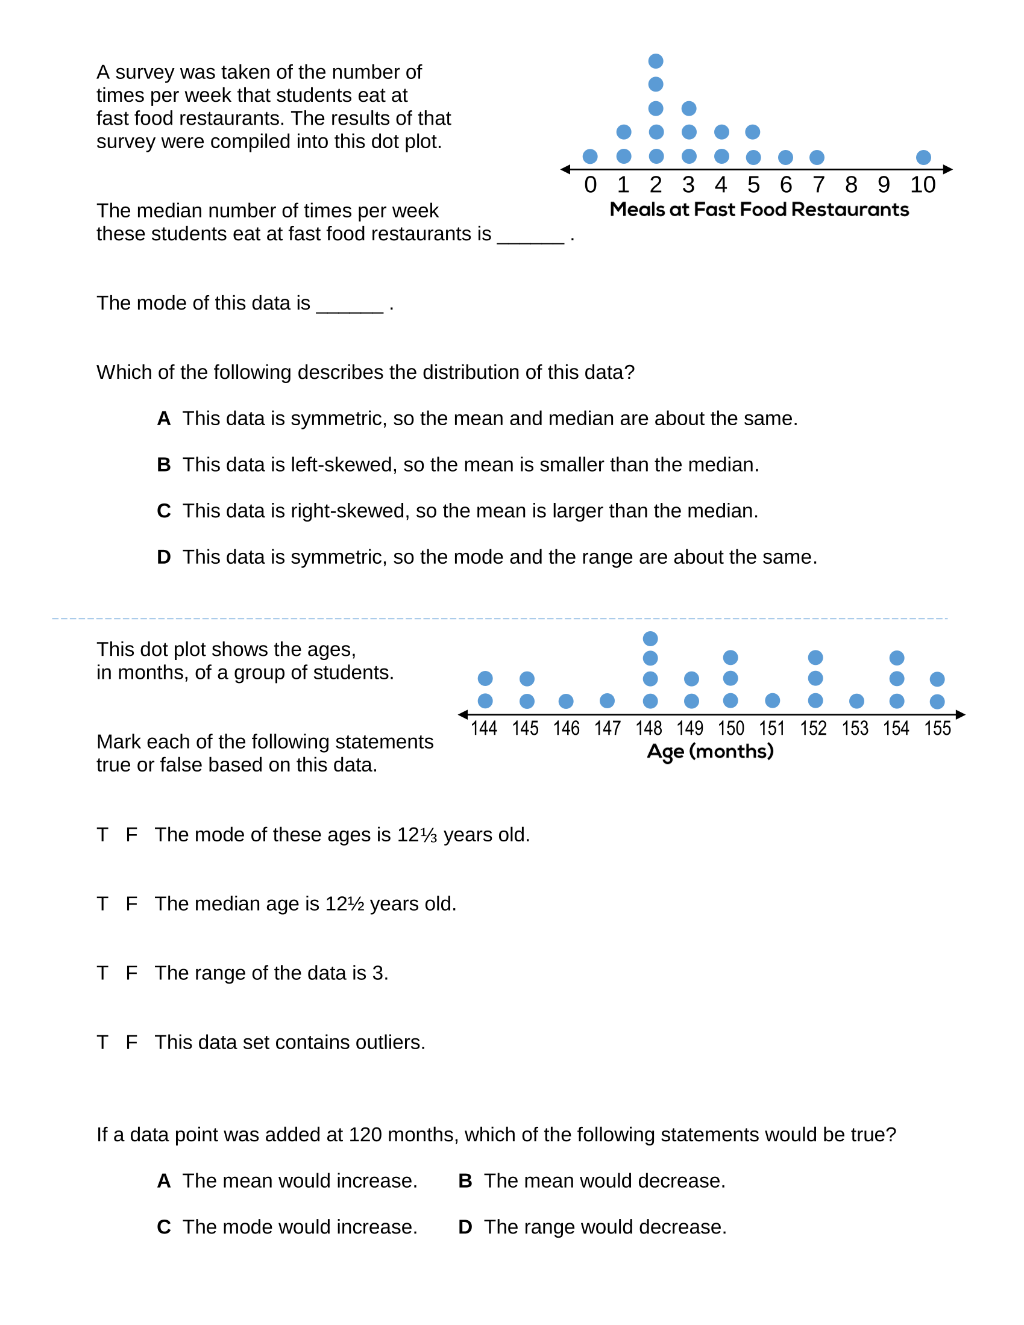
This dot plot shows the ages, in months, of a group of students. Mark each of the following statements true or false based on this data. T F The mode of these ages is 12⅓ years old. T F The median age is 12½ years old. T F The range of the data is 3. T F This data set contains outliers.
Preview 1

Preview 2

Preview 3

Preview 4

Preview 5

Preview 6
