Preview 1

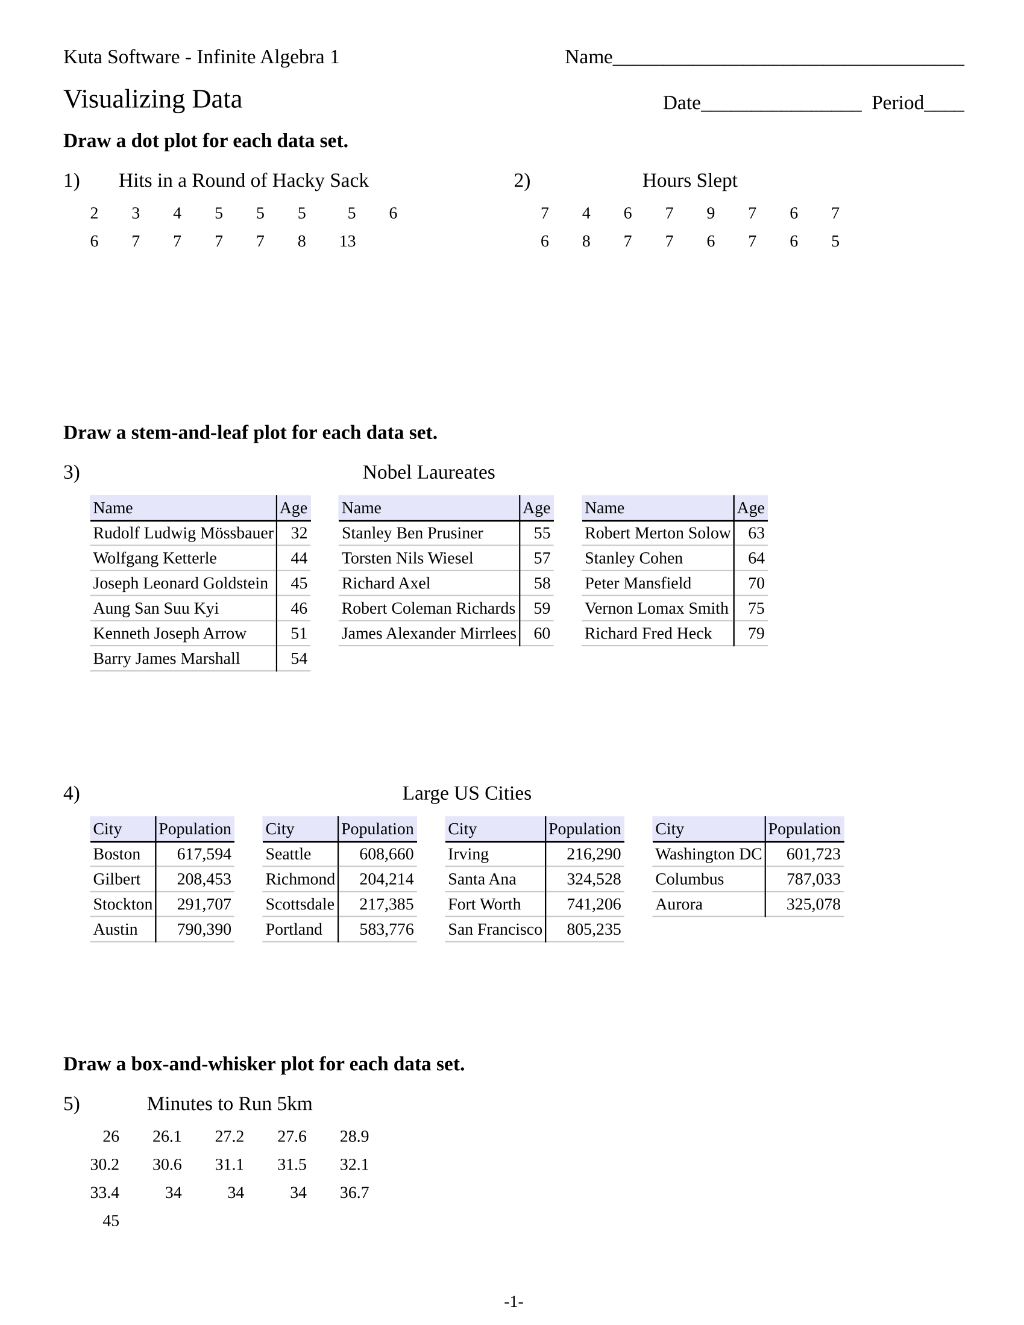
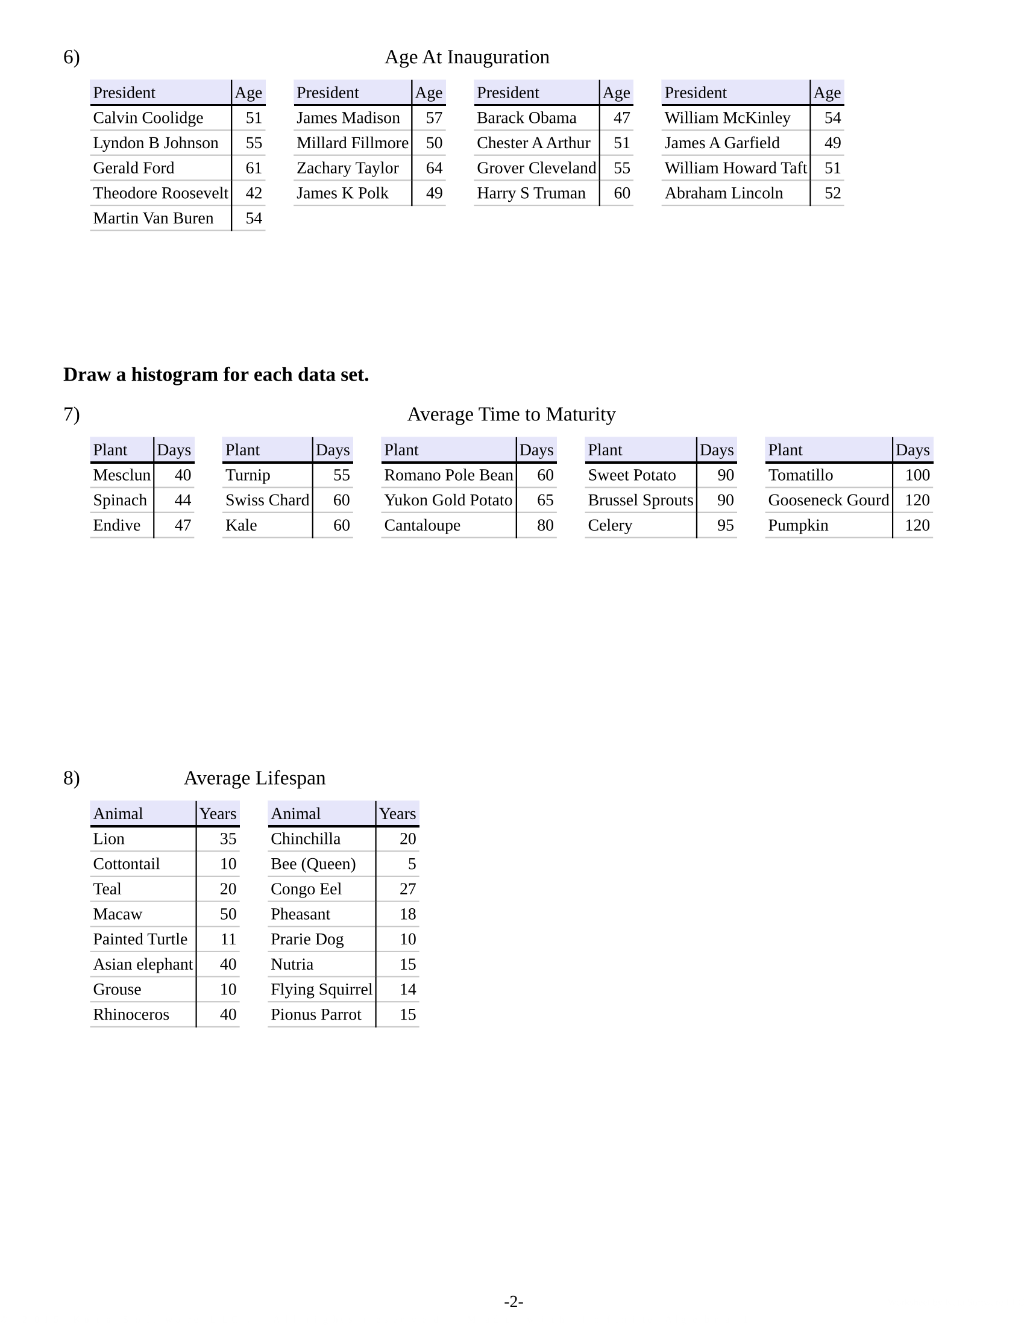
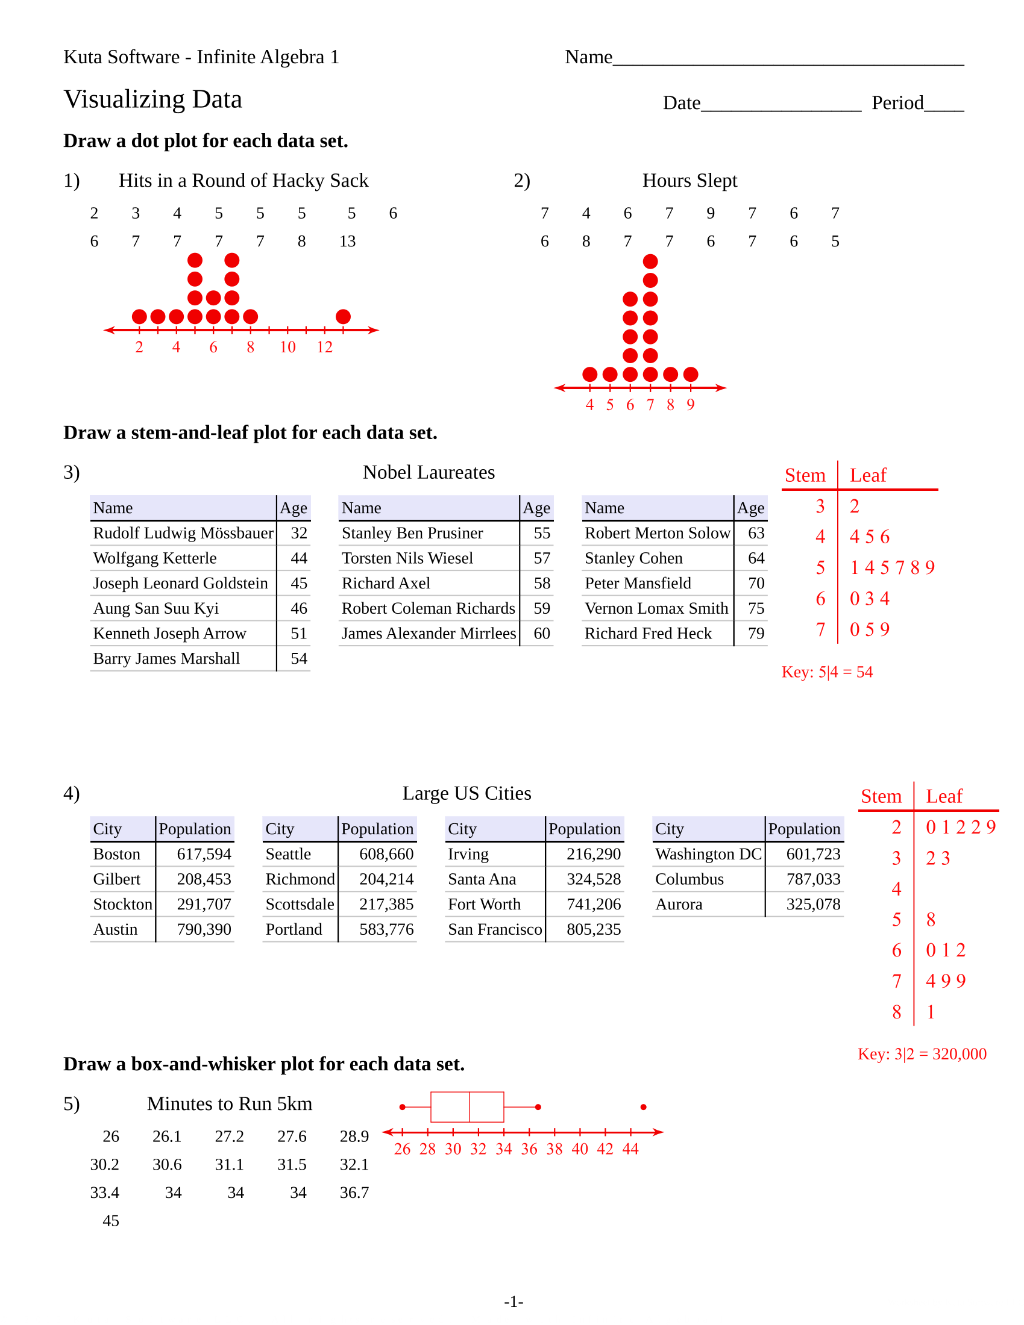
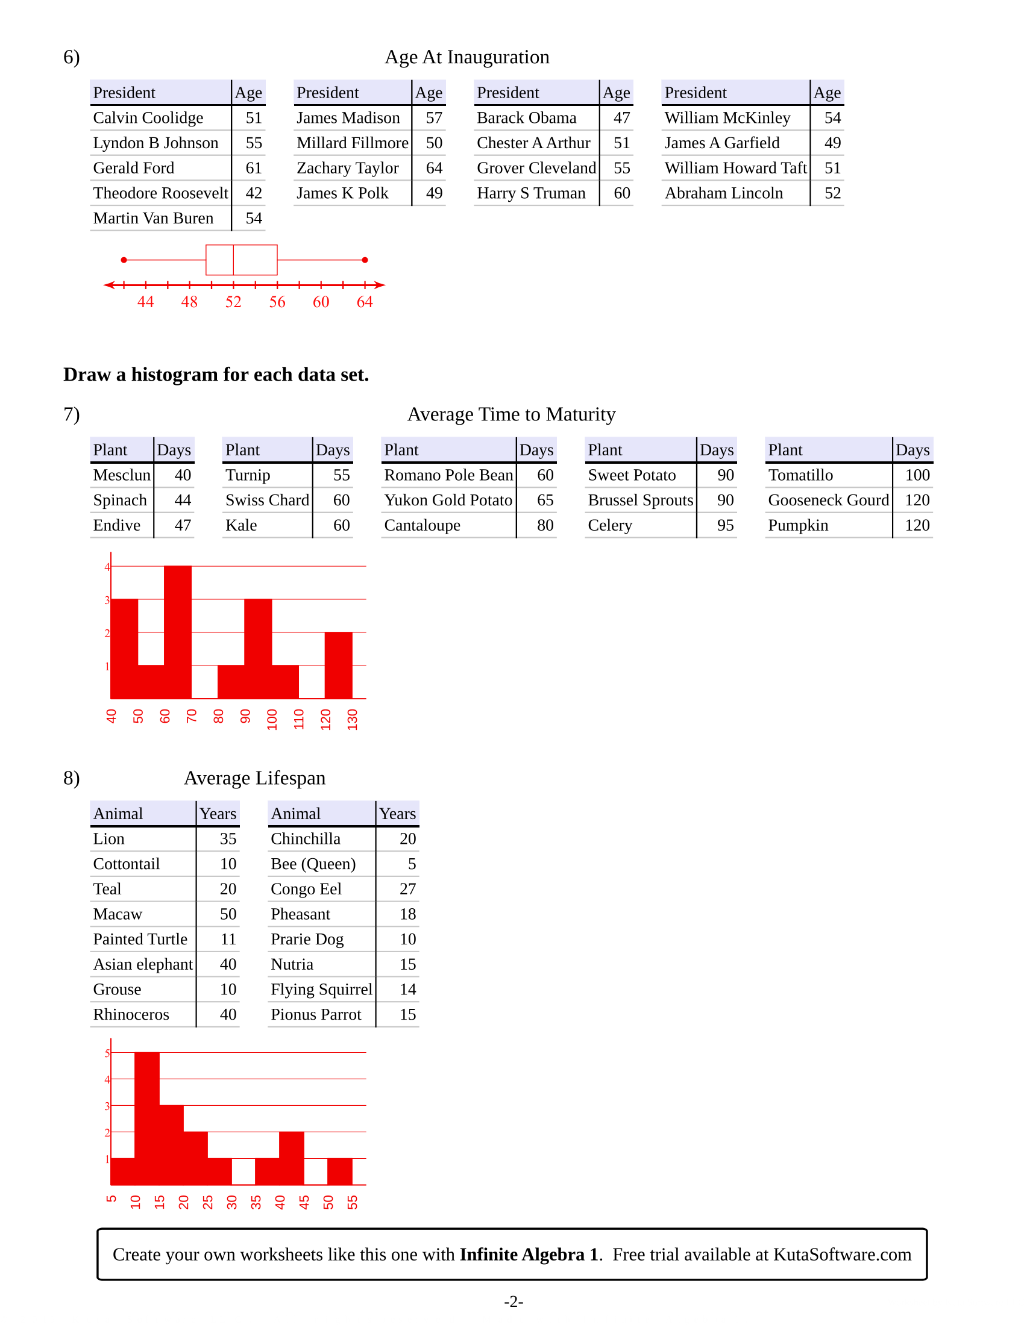
Draw a dot plot for each data set. 1) 234 555 56 677 778 13 Hits in a Round of Hacky Sack 2) 746 797 67 687 767 65 Hours Slept Draw a stem-and-leaf plot for each data set. ... Create your own worksheets like this one with Infinite Algebra 1. Free trial available at KutaSoftware.com. Title: document1
Preview 1

Preview 2

Preview 3

Preview 4

Preview 5

Preview 6
